The article below is from our archives. The information or data contained here may not be kept current.
RESEARCH AND ANALYSIS
11%—THE AVERAGE SHARE OF CHANGE IN
CONTROL VALUE FOR THE CORE EXECUTIVE TEAM*
RESEARCH AND ANALYSIS
11%—THE AVERAGE SHARE OF CHANGE IN CONTROL VALUE FOR THE CORE EXECUTIVE TEAM*
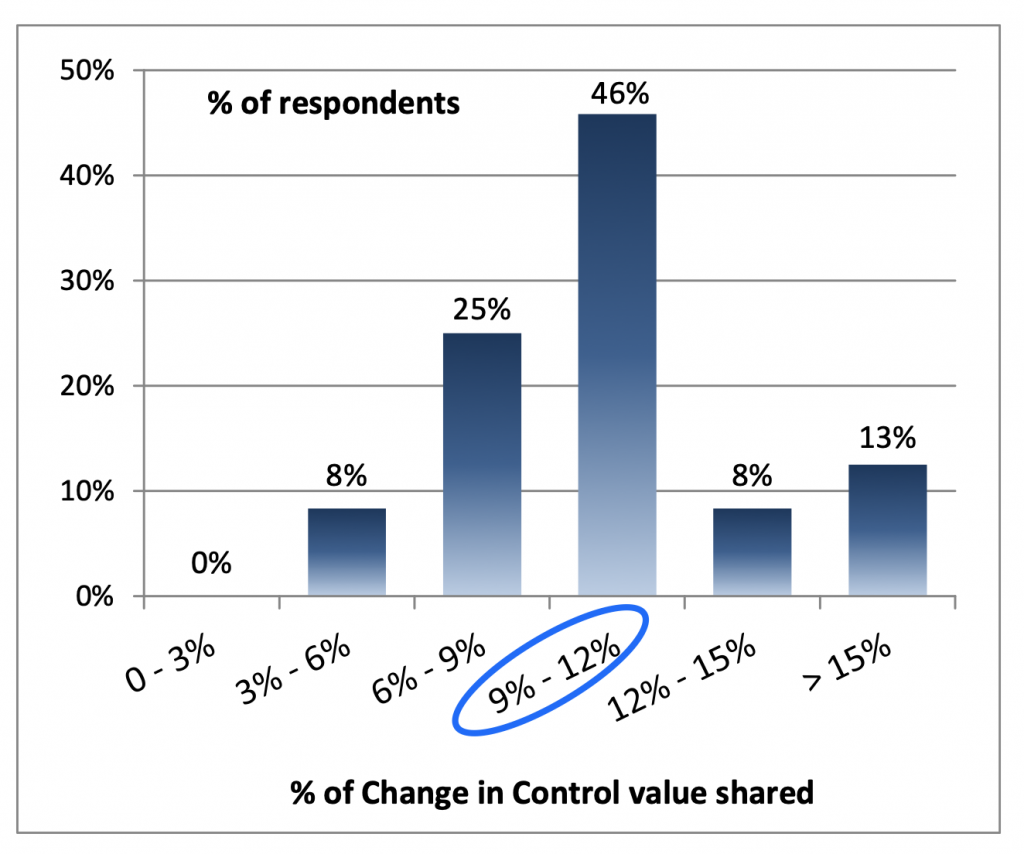
The BOLD Value team recently completed an in-depth analysis of value-sharing programs implemented by private companies leading up to a change in control or company sale. The project focused on the amount of equity (either true or synthetic) provided to key employees to maximize company value at change in control. The average value-sharing amount was 11% (for a $1 billion deal, $110 million in long-term executive compensation)*.
Value-sharing programs are fundamental to business succession – not only for executive compensation but also capital structure and exit planning, three areas in which our BOLD Value team specializes. Value sharing programs can make or break the sustainability of the management team. In some cases, long term value sharing programs are the single largest “investment” a company will make for any purpose. Accordingly, proper design, sizing, communication and administration of these programs are essential.
Based on the survey and analysis results, we found the following:
Survey Result: Amount of Value Sharing at Change in Control
*Results from 24 experienced deal practitioner respondents, out of approximately 100 practitioners queried. Deal practitioners based responses on multiple deals based on actual value shared upon change in control or as an incentive pool leading to change in control for $1Billion or equivalent size deals. Value share amounts include company CEO as part of the Core Executive Team.
These findings may offer valuable insights to business owners, boards, executives, and M&A and benefits professionals who wish to help private companies achieve high performance by attracting, retaining, and rewarding great talent.
Total Amount of Value Share for larger middle market companies (typically over $100M of company value)
- Private companies that have value-sharing plans carve out approximately 11% of the company equity value on a weighted average basis, either as equity-denominated long term incentive pools or as change in control bonuses.
- Value sharing may be denominated in both equity (restricted stock grants, stock options, etc.) and synthetic equity programs (phantom stock, liability SARs, etc.)
- At smaller companies (valuation of $20M or less), we often see value sharing plans in the range of 15% to 25% or higher for key management, typically rewarding long tenure and highly sought-after capabilities.
- This 11% includes value sharing for the entire core management team. If the CEO is also an outright material owner, the value sharing is less (perhaps around 2% less).
- Value-sharing plans show a very high variance among private companies. A survey data published in January 2012 by WorldatWork/Vivient illustrates that roughly one-third of companies have no such plans, one-third share up to 10%, and one-third share over 10% (sometimes over 25%).
- Value-share decisions are contextual and unique to the company, depending on a broad set of factors such as stage and characteristics of the business, intensity of war for talent, pay philosophy, and capital structure.
- Public companies average about 11% median value-sharing amount, according to a study by Frederick W. Cook & Co. (technology: 15.5%; retail: 11.6%; manufacturing: 8.9%; financial: 8.2% as of 2010).
Structure of Value Share Programs
- It is increasingly common for private companies to offer a mix of plans that provide liquidity throughout the company lifecycle. Some companies, for example, offer plans that provide executives some liquidity on a rolling 3 to 5 year basis, upon separation from service, or change in control.
- Deal practitioners often recommend capping, in some way, the amounts paid to critical executives for value-sharing plans that pay out in the event of change in control. This cap is intended to ensure that the buyer can retain these executives after the transaction. Some respondents cited six times latest total cash compensation as an upper limit.
- The use of synthetic equity such as phantom stock or units grew by over 70% in 2011 vs. 2007 at private companies, according to a WorldatWork/Vivient survey. Similarly, the use of performance-based awards (rather than outright stock options and restricted stock/units) at public companies grew by 230% over the past dozen years, based on the article by James F. Reda et al. in the May/June 2013 issue of the Journal of Compensation and Benefits.
- Synthetic equity enables companies to offer more customized long-term pay for performance plans. Our BOLD Value team, for example, has designed several synthetic equity “value band” plans offering gradually higher value sharing as the company increases in equity value. Similarly, we have recently designed enterprise-value plans to reward key executives for enterprise growth without adjustment for changes in capital structure (particularly important in the context of leveraged buyouts, including ESOPs).
Note on the Findings: Private companies report on long-term incentives differently according to the WordatWork/Vivient survey. In some cases, the value-share percentages refer to equity overhang regardless of the type of the equity incentive vehicle. In other cases, private companies report on net effective dilution after consideration of strike prices.
Contact us to find more about our recent study and tools & techniques for crafting solutions that balance the needs of the ownership team, the management team, and the company as a high performance organization. Please visit our website at www.boldvalue.com. Articles highlighting Synthetic Equity and other executive compensation, capital structure, and exit planning solutions are available on our website.
CRN-1720364-022717